
Summary
Technology is helping the world survive through the sanitary, economical and societal crisis that the Covid19 virus has caused. AI helps scientists understand the virus to find a cure/vaccine. Mobile apps keep families and friends connected from afar. IoT is used to manage the virus spread through Bluetooth peer-to-peer interactions. More examples of how technology is helping are laid out in many blog posts. In this blog post, I focus on how Streaming technology can help supply chains during the crisis.
How is Supply Chain challenged?
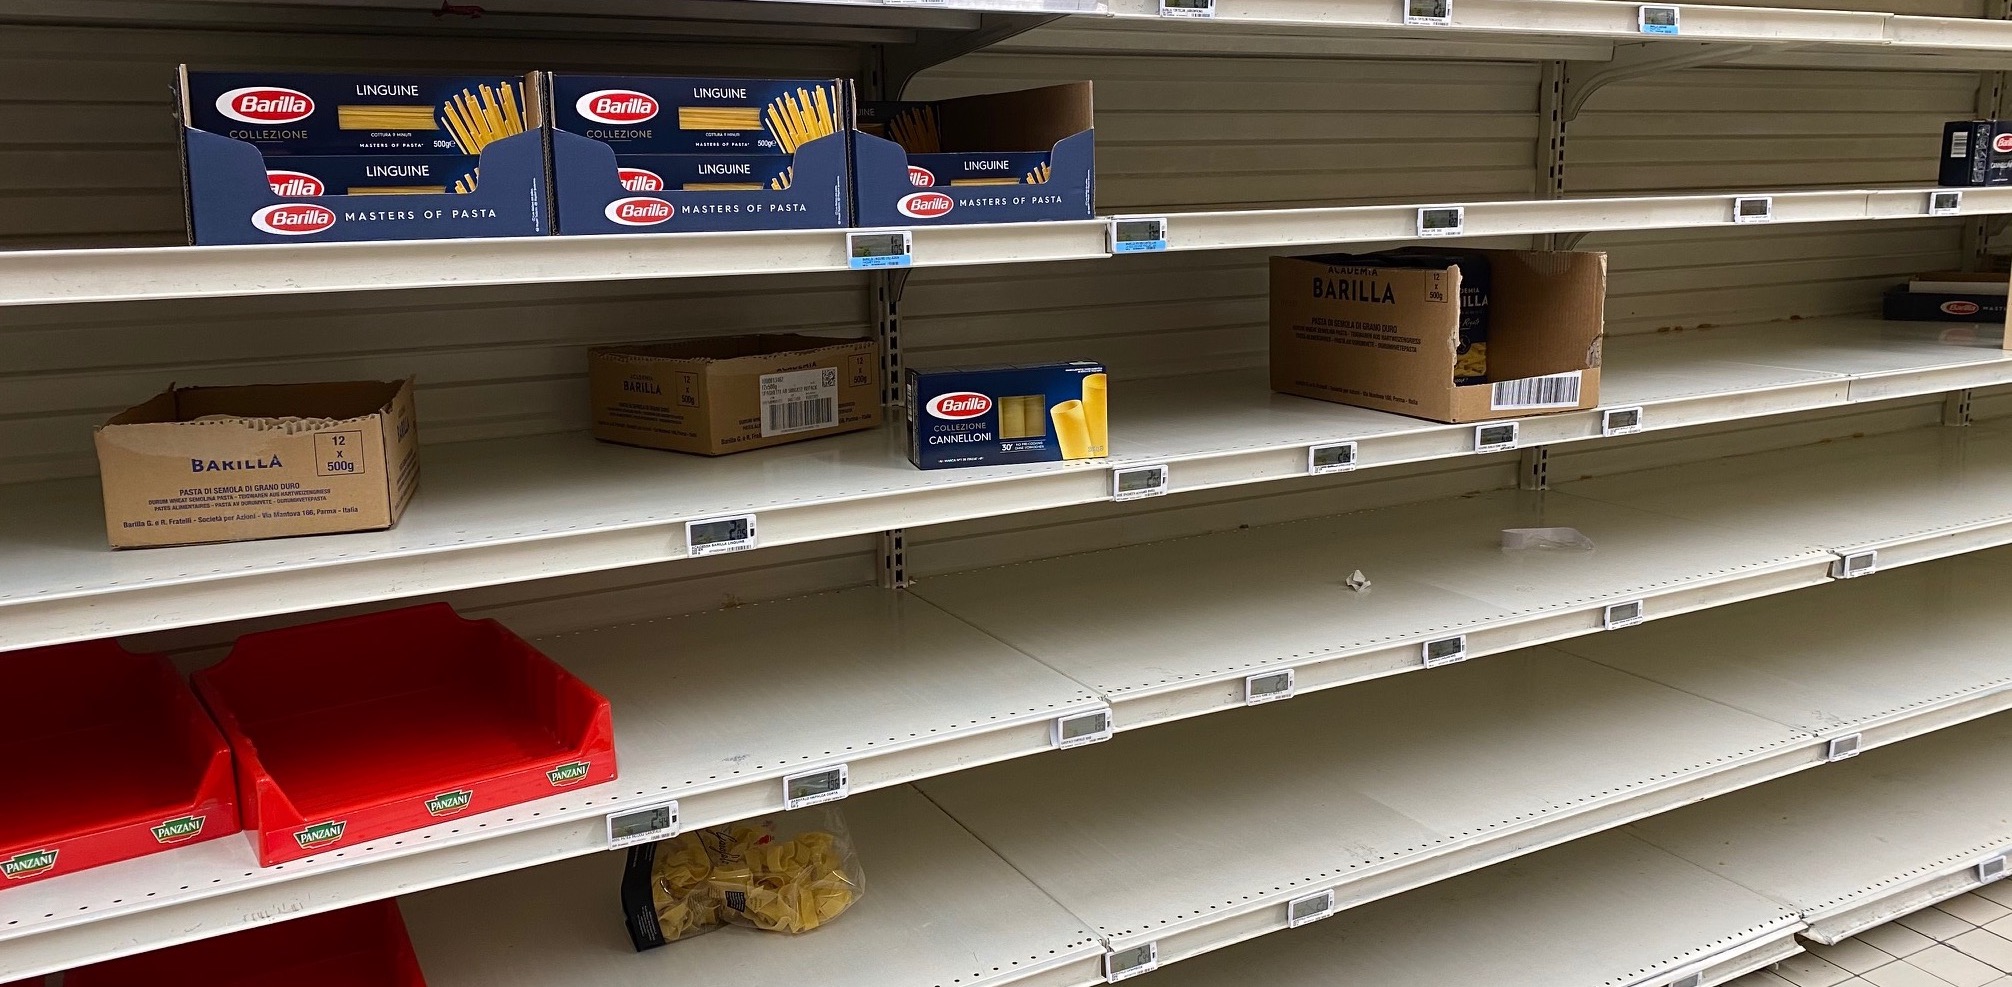
A picture is worth a thousand words. Above is a picture I took in a Parisian store just few days before announcing the lock-down. Scary, right? Under anxiety, people started stocking up food although the CPG industry had announced there would be no shortages. This behavior created temporary shortages which scared people and hindered their trust in the official information. They started stocking up themselves, making the situation worse. Vicious circle.
Retail is just an example that is well known to the public. Hospitals Supply Chain challenges are much bigger. The exponential number of Covid19 cases creates a continuous stress on test kits, personal protective equipment, drugs, ICU beds, ventilators and staff. In France, patients are moved between cities with medical trains and flights. Some of them are taken care of in Germany. Airlines are helping in cargo activities moving millions of masks from China. Every decision needs to be taken fast with many unknowns, and can impact people’s lives.
But with big challenges come big opportunities.
With IoT and a Streaming Platform, we get a real-time view on stocks and demand across a whole provider, country or even an industry. We can instantly trigger alerts when stocks are running out faster because of unexpected demand. Actions can be prioritized, decisions become backed by data, they can be made quickly to adapt to changing patterns. Furthermore, this platform helps gather more data hence making predictions more accurate.
An Open Source Event-Driven Retail Supply Chain
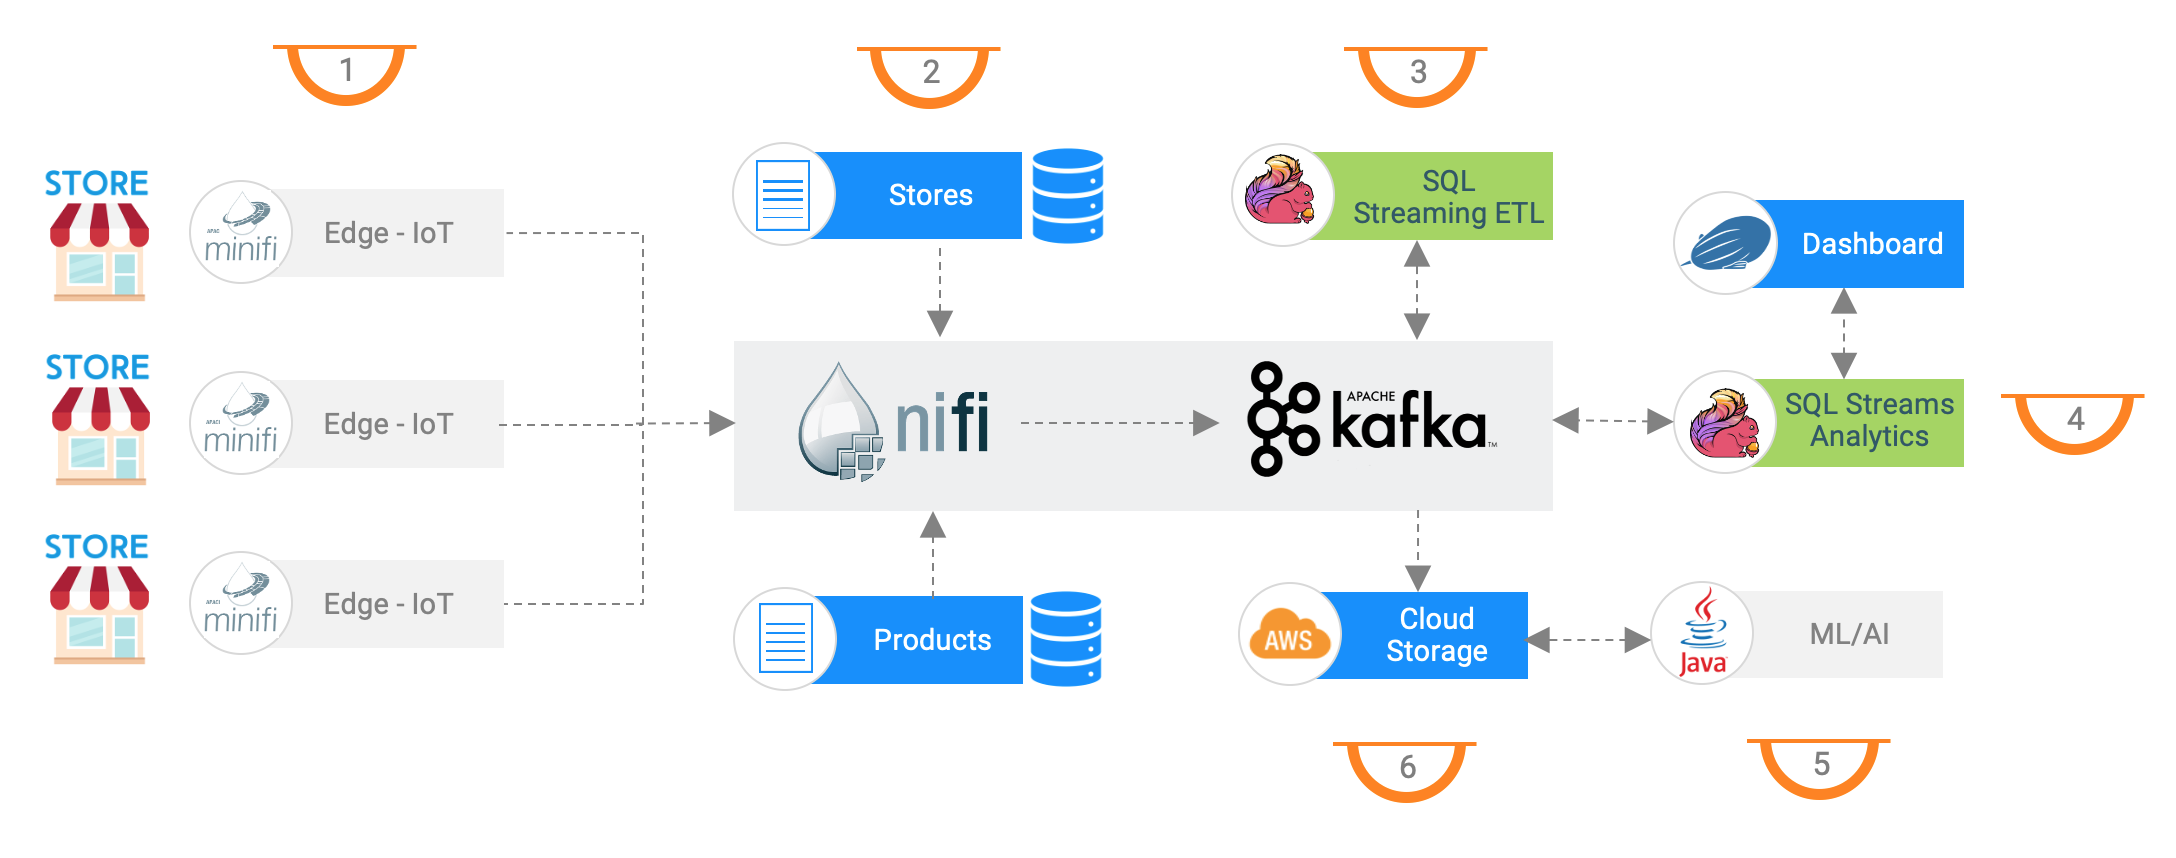
To get practical, let’s see how we can implement this vision with the Open Source software available in Cloudera Data Platform and Cloudera Data Flow. The architecture uses:
- MiNiFi: small data collection agents are deployed in every Point Of Sales (POS) to collect sales transactions and send them in real time to the data center or the cloud.
- Apache NiFi: collects sales events coming from the agents and send them to the Apache Kafka broker. NiFi also ingests data about stores and products from several DBs in realtime into Kafka.
- Apache Flink: processes data coming from different Kafka topics to enrich POS events, aggregate them on time windows, detect threshold violations, etc. Apache Flink has an SQL API that make writing pipelines easier.
- Apache Zeppelin: is an interactive notebook that supports Apache Flink and Flink SQL for exploring data, building real-time dashboard and communicating information with different teams.
- Kafka Connect: collects events from different topics and store them into a Cloud Storage like S3 or ADLS. Data is persisted on cheaper storage for long term archival or other batch use cases.
- Cloudera Machine Learning: process data, train machine learning models, extract features and predict future patterns based on various set of data.
In the coming sections, we will focus on the event streaming pipeline.
Data model and ingestion
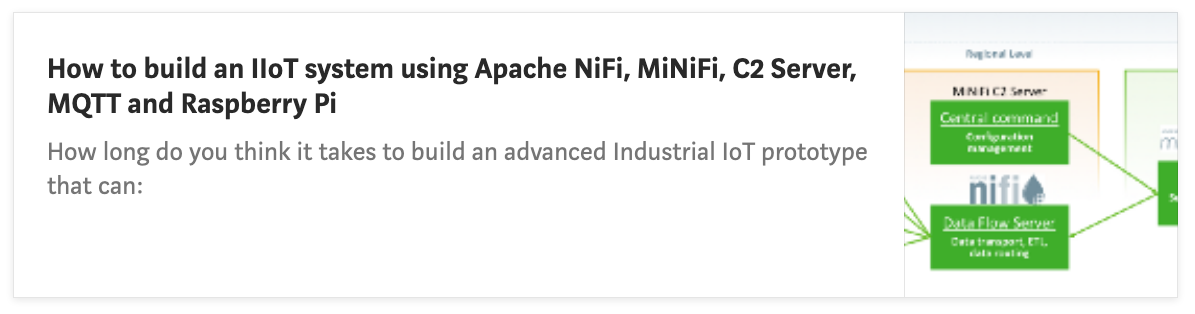
I have covered NiFi and MiNiFi capabilities in several blogs. We can deploy thousands of small agents into stores and control them from a central location. Each agent can locally collect data from a data source at the store (a database, a file or a lightweight broker like MQTT) and send it to a central NiFi. For more information on this part, please refer to the detailed blog post I wrote about how to build an Industrial IoT system, then replace a factory by a store.
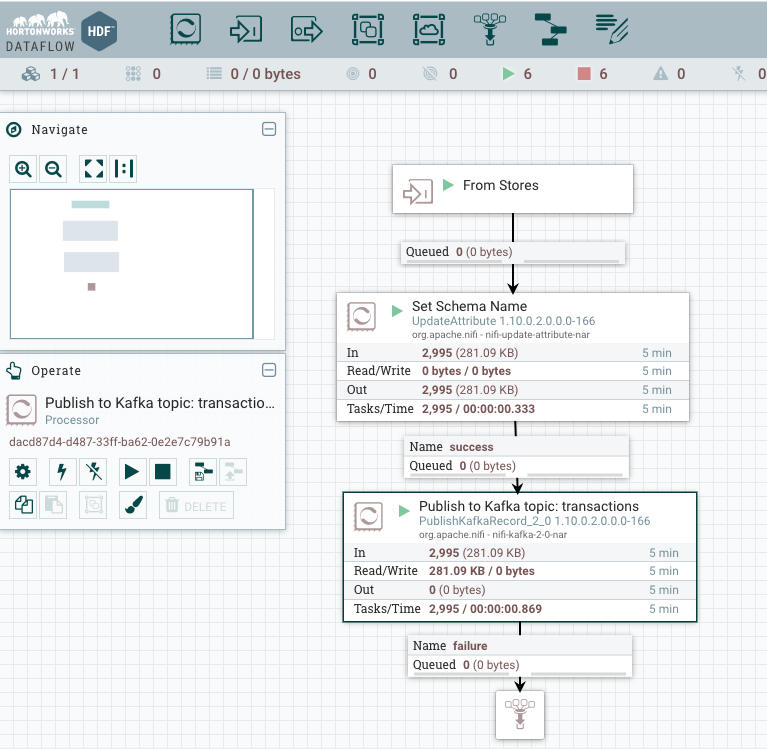
Once data is received in NiFi, we can publish events to Kafka with a simple flow. The below flow attach a schema name (pos) to each event, and push it to the pos Kafka topic.
Events coming from stores has the below attributes. This event means Store ‘5’ sold 3 items of Product ‘8’.
1
2
3
4
5
6
7
{
  "tstx" : "1586615062225", //transaction timestamp
  "idtx" : "1871134",// transaction identifier
  "idstore" : 5, // store identifier
  "idproduct" : 8, // product identifier
  "quantity" : 3 // quantity at which the product was sold
}
Similarly, NiFi can monitor several tables and incrementally ingest new or updated rows into Kafka. In our use case, we ingest data from a stores table that has details on every store such us name and location.
1
2
3
4
5
{
  "idstore":1,
  "namestore":"supermarket",
  "city":"paris"
}
We also ingest data from a products table that has details on every product such us as product name and observed average sold quantity at a given frequency.
1
2
3
4
5
{
  "idproduct":8,
  "nameproduct":"hand-sanitiser",
  "avgsales":2
}
The results of the data ingestion can be seen in the following video where I use Streams Messaging Manager to explore the content of the three Kafka topics : pos, stores and products. These topics are partitioned and events are distributed based on the id field to load balance the processing later. We have also prepared a forth topic, alerts, that we will use later to send alerts when we detect that a product is being sold faster than usual. From the video, you can also see the producers to and consumer from each topic.
Data exploration with Flink SQL and Zeppelin
Apache Flink is a modern, Open Source, streaming engine that we will use to build our data pipeline. Flink can be used for real-time ETL where events are transformed in real-time. It can also be used to compute advanced KPI based on different time manipulation (event time and processing time, windowing, statefull processing etc). Apache Flink has powerful APIs such as DataStream and ProcessFunction APIs that can be used to build modern event-driven applications. It also has easy-to-use Table and SQL API that democratize the technology to analyst users. We will leverage the SQL API to make this blog accessible to a wider community. To use Flink SQL, the out-of-the-box option is the SQL Client CLI. Let’s use it first to explore the content of the POS topic:
The Flink SQL CLI is nice for simple analysis. However, it’s not convenient for data exploration where you want to test and adapt several queries. Fortunately, Apache Zeppelin, the datascience notebook, supports running Flink and Flink SQL code. We will use it in the coming sections. Let’s get started!
What do we have in hands?
To process our streams in FlinkSQL, we need to create tables. A table define the schema of events in a Kafka topic and provide access to the SQL API. For instance, to create a table of our POS stream, we can use:
1
2
3
4
5
6
7
8
9
10
11
12
13
14
15
16
17
CREATE TABLE pos (
   tstx BIGINT,
   idtx BIGINT,
   idstore INT,
   idproduct INT,
   quantity INT,
   timetx AS CAST(from_unixtime(floor(tstx/1000)) AS TIMESTAMP(3)),
   WATERMARK FOR timetx AS timetx - INTERVAL '10' SECOND
) WITH (
   'connector.type' = 'kafka',
   'connector.version' = 'universal',
   'connector.topic' = 'pos',
   'connector.startup-mode' = 'latest-offset',
   'connector.properties.bootstrap.servers' = 'kafka-url:9092',
   'connector.properties.group.id' = 'FlinkSQLPOS',
   'format.type' = 'json'
);
This creates a table called pos that points to events inside the pos Kafka topic. These events are in JSON format and has the five attributes we introduced previously. In addition to these attributes, it defines an event time field which is computed from the transaction timestamp (tstx) and defines a watermark of 10 seconds. The table uses the Flink Kafka connector and connect to the cluster running in edge2ai-1.dim.local:9092.
Similiarly, we need to create stores and product tables before using them in Flink SQL.
1
2
3
4
5
6
7
8
9
10
11
12
13
CREATE TABLE stores (
   idstore INT,
   namestore STRING,
   city STRING
) WITH (
   'connector.type' = 'kafka',
   'connector.version' = 'universal',
   'connector.topic' = 'stores',
   'connector.startup-mode' = 'earliest-offset',
   'connector.properties.bootstrap.servers' = 'kafka-url:9092',
   'connector.properties.group.id' = 'FlinkSQLStore',
   'format.type' = 'json'
);
1
2
3
4
5
6
7
8
9
10
11
12
13
CREATE TABLE products (
   idproduct INT,
   nameproduct STRING,
   avgsales INT
) WITH (
   'connector.type' = 'kafka',
   'connector.version' = 'universal',
   'connector.topic' = 'products',
   'connector.startup-mode' = 'earliest-offset',
   'connector.properties.bootstrap.servers' = 'kafka-url:9092',
   'connector.properties.group.id' = 'FlinkSQLProducts',
   'format.type' = 'json'
);
We are ready to query our tables: SELECT * FROM pos. It’s as easy as querying data in a SQL database. Here’s how this looks like in Zeppelin. Events are continuously consumed from Kafka and printed in the UI. The FlinkSQL job is visible on the Flink dashboard and the Yarn UI.
Zeppelin has a nice feature of simple data visualization embedded in the notebook. We can use it to plot our events grouped by product and store. This is useful for quick exploration only this is applied on the result sets only and not all data or a time window. Real grouping should be done in FlinkSQL later.
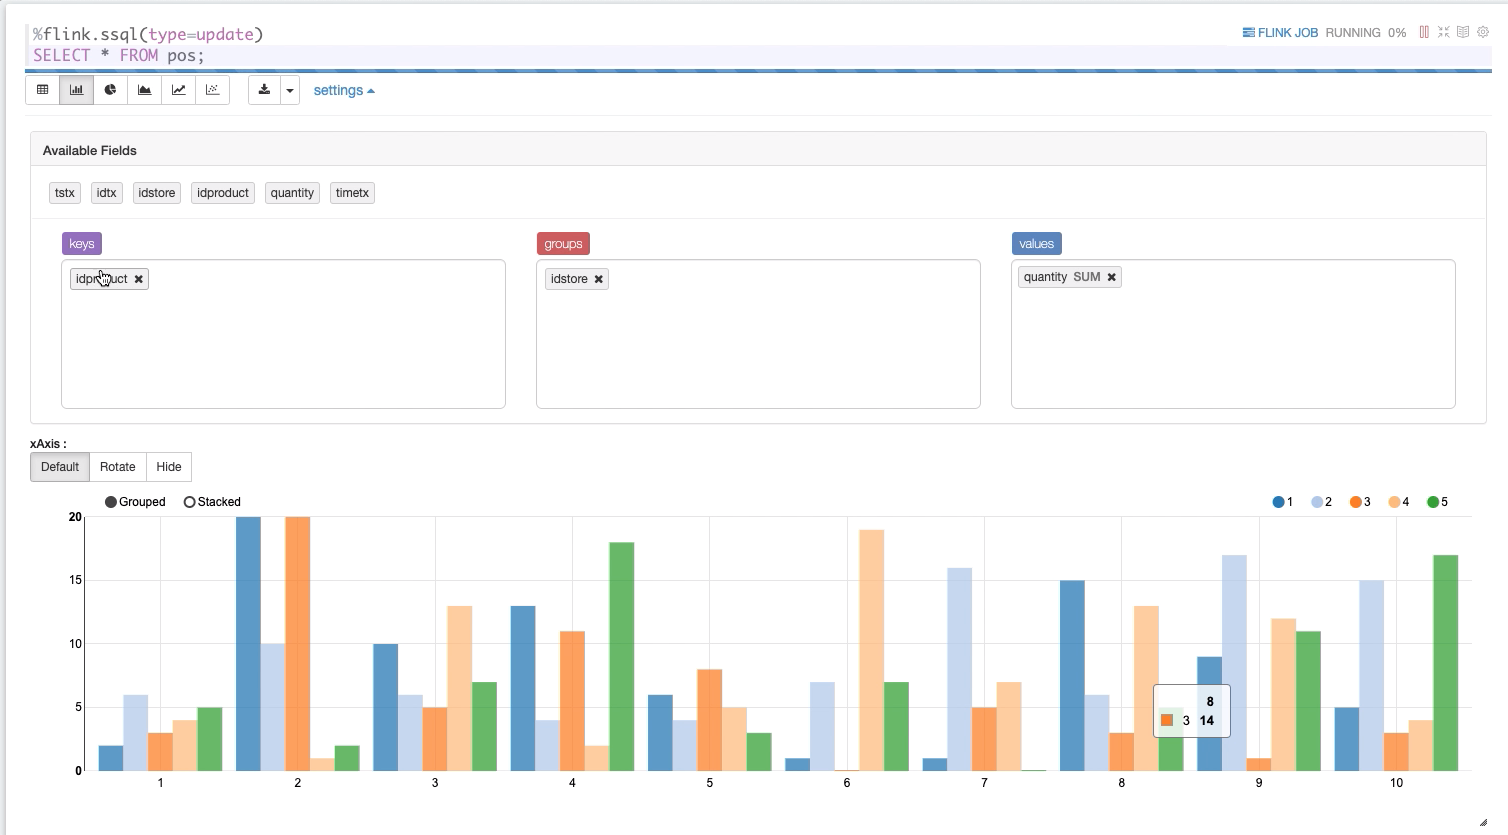
Stream to Stream Joins and enrichment
In the previous graph, we can see events grouped per product and store. However, we only have products and store IDs. Not really useful to understand what’s happening. We can enrich the transactions by joining the POS stream with products and stores streams. Using the idproduct and idstore, we can get other metadata such as the product name and the city.
Keep in mind that the POS stream is a high velocity append-only stream, also known as facts table in the Data WareHouse world (DWH). Stores and Products are slowly changing streams, known as dimensions tables in the DWH world. They are also append-only streams, where an update is a new event with an existing ID. Even if streams joins looks similar to tables joins, there are fundamental differences. For instance, if I have several events on product x, which one will I join with a POS event? the newest one? the one with the closest timestamp? To keep this blog simple, I’ll ignore these aspects for now and I will publish a deep dive blog on streams joins in the coming days.
Going to FlinkSQL, here’s how we can join our three streams:
1
2
3
4
5
6
SELECT tstx,idtx, namestore, city, nameproduct, quantity
FROM
   pos AS po,
   stores AS s,
   products AS pr
WHERE po.idstore = s.idstore AND po.idproduct = pr.idproduct;
Using the join with Zeppelin graphs, we can see how fast our product are sold in every city. The following video show the execution of the query.
Detect products running out fast
Now that we have a better understanding of our data, we can look for the products sale pattern and compare them to historical data. We can not have someone monitor the dashboard all the time, we would like to generate alerts instead.
Remember, in our products table, we have a column, avgsales, that tells us the average quantity we usually sell for every product in every store at a given time scale (4 hours for instance). For demo purposes, we will consider a very short time scale (15 seconds) to accelerate things. So how can we detect that a product is being sold fast?
First, we need to aggregate our POS events on time windows of 15 seconds. For each window, we would like to compute the sum of sold quantity. We would like to do so per store also, hence grouping by store as well. The query looks like the following. Note that the query introduces two new columns, starttime and endtime which represent the time window start and end respectively.
1
2
3
SELECT TUMBLE_START(timetx, INTERVAL '15' SECOND) as starttime, TUMBLE_END(timetx, INTERVAL '15' SECOND) as endtime, idstore, idproduct, SUM(quantity) as aggregate
FROM pos
GROUP BY idproduct,idstore, TUMBLE(timetx, INTERVAL '15' SECOND)
Once we have the aggregates stream, we would like to join it with stores and products streams to get the other fields such as avgsales. We would like to compare the computed aggregate quantity, aggregate, with the hostorical avgsales. This gives us the complete query:
1
2
3
4
5
6
7
8
9
10
11
12
SELECT starttime, endtime, nameproduct, aggregate, avgsales, namestore, city
FROM
  (
    SELECT TUMBLE_START(timetx, INTERVAL '30' SECOND) as starttime,
    TUMBLE_END(timetx, INTERVAL '30' SECOND) as endtime, idstore,
    idproduct, SUM(quantity) as aggregate
    FROM pos
    GROUP BY idproduct,idstore, TUMBLE(timetx, INTERVAL '30' SECOND)
  ) AS a,
  products as p,
  stores as s
WHERE aggregate > avgsales AND a.idproduct = p.idproduct AND a.idstore = s.idstore;
The following video shows the execution of the query in Zeppelin and the query plan generated in the Flink dashboard. We can observe that hand sanitiser is getting buyed faster than usual in all cities.
Creating a new alerts stream
Now that we are happy with our data processing and exploration, we need to create a new stream of alerts. This stream can be used to send push notification to a store manager through a mobile app. Upon receiving this notification, the store manager can ask an employee to refill the shelf of a particular product in priority. This is really important in crisis times where the number of employee can get reduced. This will help proactively manage local activities to avoid having empty shelfs, which reduce the anxiety and the urge of buying a product that may become unavailable.
FlinkSQL can be used to create new Kafka Streams as well. We have to create a new table as we did previously.
1
2
3
4
5
6
7
8
9
10
11
12
13
14
15
16
17
CREATE TABLE alerts (
   starttime TIMESTAMP(3),
   endtime TIMESTAMP(3),
   nameproduct STRING,
   aggregate INT,
   avgsales INT,
   namestore STRING,
   city STRING
) WITH (
   'connector.type' = 'kafka',
   'connector.version' = 'universal',
   'connector.topic' = 'alerts',
   'connector.startup-mode' = 'latest-offset',
   'connector.properties.bootstrap.servers' = 'kafka-url:9092',
   'connector.properties.group.id' = 'FlinkSQLAlerting',
   'format.type' = 'json'
);
Then, we can embed our previous aggregation and alerting query into an insert into statement.
1
2
3
4
5
6
7
8
9
10
11
12
13
14
15
INSERT INTO alerts
   SELECT starttime, endtime, nameproduct, aggregate, avgsales,
          namestore, city
   FROM
     (
     SELECT TUMBLE_START(timetx, INTERVAL '15' SECOND) as
        starttime, TUMBLE_END(timetx, INTERVAL '15' SECOND) as
        endtime, idstore, idproduct, SUM(quantity) as aggregate
     FROM pos
     GROUP BY idproduct,idstore, TUMBLE(timetx, INTERVAL '15'
     SECOND) ) AS a,
     products as p,
     stores as s
   WHERE aggregate > avgsales AND a.idproduct = p.idproduct AND
   a.idstore = s.idstore;
With this, all generated alerts are send into the alerts Kafka topic as we can see in SMM. From Kafka, we can have a NiFi, KStreams or Java apps subscribing to these alert events and pushing them into our store managers.
Conclusions
In this blog, we explained how a streaming platform can enable any supply chain to get real time insights. These insights are a game changer in a crisis situation where demand is huge and uncertainty increasing. This is exactly what we are living nowadays with the Covid19 crisis.
We also showed how we can build an advanced event-driven alerting system with no line of code using tools like Apache NiFi, Apache Flink and Apache Zeppelin. Flink provides advanced streams operations like streaming joins and windowing with a simple SQL API. Building an advanced real-time supply chain system become accessible to everyone. Event Streaming platforms like CDF package all these tools into a unified stack that’s easy to deploy and use.
In a future blog, I’ll cover streams join types in Flink and Flink SQL. If you are interested in a deeper dive on these topics, come back to this blog in few days.
Thanks for reading this far. As always, feedback and suggestions are welcome.